.png)
 German (DE)
  English (US)
  Spanish (ES)
  French (FR)
  Hindi (IN)
  Italian (IT)
  Russian (RU)
  4 hours ago
2
4 hours ago
2
NEW DELHI: As the Uttar Pradesh government, led by chief minister Yogi Adityanath, completes eight years, the data showcases what a 'double-engine' administration can achieve. On Wednesday, chief minister Yogi Adityanath stated that Uttar Pradesh's economic growth has outpaced the national average and that the state budget for the next fiscal year serves as a tool to drive development to the last mile.
Presenting a comprehensive overview of the state's economy in the Legislative Council, the CM asserted that this year's budget reflects the government's strong commitment to accelerating economic growth while increasing per capita income.
Here are 10 charts that illustrate how Uttar Pradesh has performed in terms of the economy, law and order, and more under eight years of the Yogi Adityanath government.
Economic growth and GSDP
The state's economy, which was in a challenging position in 2017, has now doubled, with the Gross State Domestic Product (GSDP) projected to reach Rs 27.51 lakh crore for the financial year 2024-2025. Per capita income has also seen substantial growth, rising from Rs 52,671 in 2016-2017 to Rs 93,514 in 2023-2024.
During the budget session, finance minister Suresh Kumar Khanna stated, "According to a report by the Reserve Bank of India, Uttar Pradesh's share of tax receipts among all states is among the highest in the country, reflecting strong financial management."
The per capita NSDP showed a steady upward trajectory, indicating stable economic growth. The per capita NSDP was record high in 2023-24 reflecting strong financial health and increased income levels in the state.
The analysis of per capita availability of power showed a steady increase in power availability over the years. The highest per capita power availability has been achieved in 2023-24, showcasing continued improvements in electricity distribution and generation capacity.
The data also showed a rapid increase in capital expenditure, suggesting a strong push toward infrastructure development and economic revival.
The social sector expenditure from 2014-15 to 2023-24, showed a steady increase over the years, with a sharp rise from 2021-22 onwards.
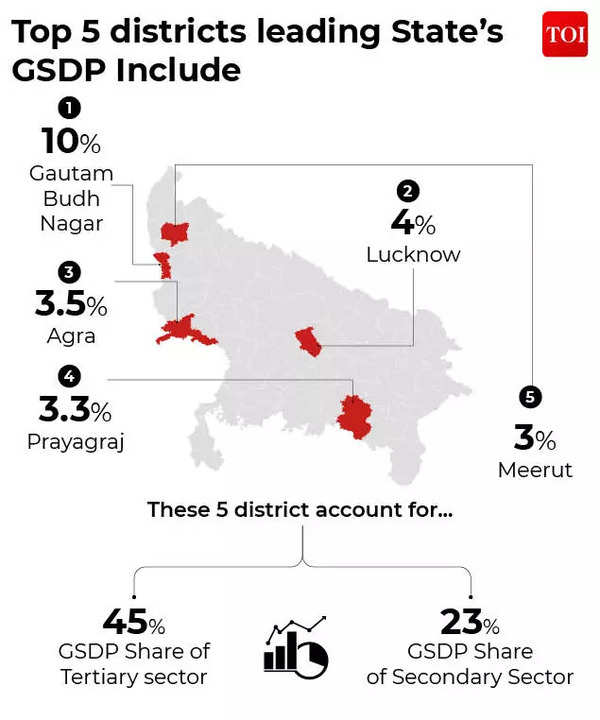
Top 5 districts and their GSDP contribution
- Gautam Budh Nagar (10%) – Home to Noida, this district is the leading contributor due to its strong industrial base, IT sector, and corporate presence.
- Lucknow (4%) – The state capital, driven by government services, retail, real estate, and the IT sector.
- Agra (3.5%) – Known for tourism (Taj Mahal), handicrafts, and manufacturing.
- Prayagraj (3.3%) – A center for education, administration, and tourism.
- Meerut (3%) – A hub for sports goods manufacturing, the metal industry, and trade.
The rural unemployment saw a sharper spike in 2017-18 but recovered faster, likely due to government interventions.
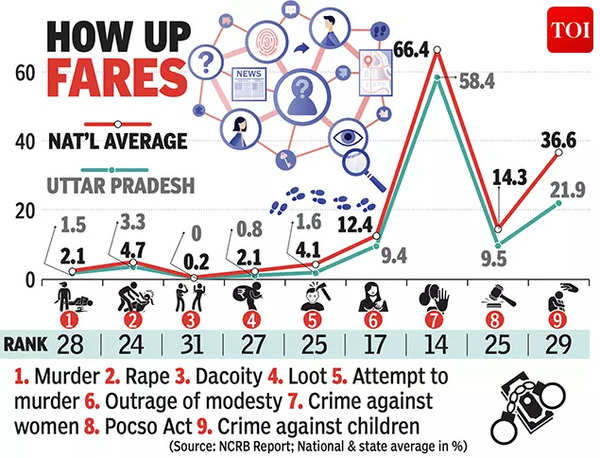
Crime and punishment
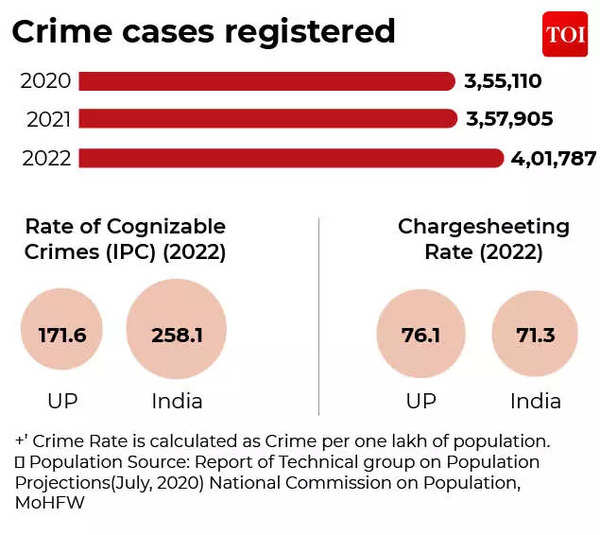
With a major crackdown by Yogi government against crime in the state, Uttar Pradesh's overall crime rate came down lower than the national average.
The charge-sheeting rate in UP is also higher than the national average, which suggests that more cases are being formally prosecuted.
The government has also worked on educational infrastructure with and the state now has 67 universities, 5,842 colleges, 3,268 ITIs/ITCs and 370 polytechnics.
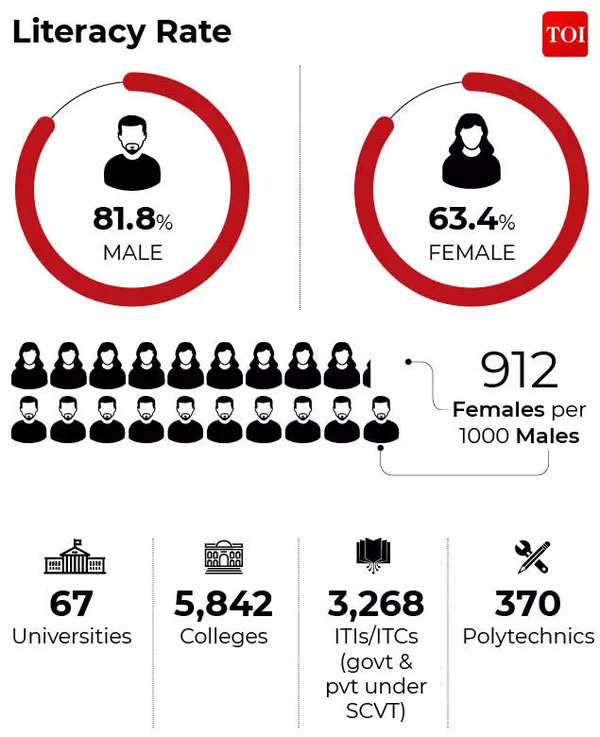
The male literacy rate is at 81.8 per cent while that of female is 63.4 per cent.


Comments